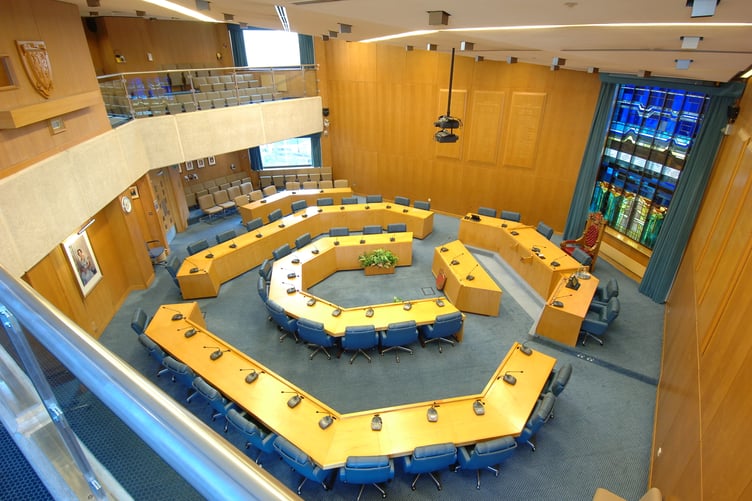
WOKING Borough Council has 30 councillors representing 10 wards. It elects its members in thirds, rather than all out as in some authorities. This means 10 councillors stand for election, every three out of four years.
The borough council is run by the Liberal Democrats, and Friday’s results saw them increase their number to 20 elected members.
Four Conservatives, three Independents and three Labour Party members make up the opposition groups.
Overall turnout for this May’s local elections was 36.66%, down from 40% last year and 40.53% in 2021. It is in line with the 2019 elections, which recorded 36.32%, in what was the second trial the borough held when photo ID was required to vote.
The lowest ward turnout was in Canalside, where 29.49% of the 7,943 electorate turned out to vote. Anila Javaid held that seat for Labour, greatly increasing the previous majority of 206 from 2019.
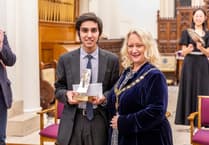
The highest ward turnout was in Horsell, where 46.69% of the 7,329 electorate exercised their democratic duty. Most of those votes went to the Lib Dem's Swati Mukerjee, who overturned the Conservative majority of 886 in 2019 to sweep to victory with 2,131 votes, 1,245 more than her nearest challenger. One of the votes came from Swati's son, who was voting in his first election.
The full list of election results from 5 May 2023 is:
Byfleet And West Byfleet
- Amanda Boote, Independent – 1656 (elected)
- Jo Brown, The Conservative Party – 581
- Danny Clarke, The Green Party – 95
- Oliver Lester, Labour Party – 176
- David O`Brien, Liberal Democrats – 312
Turnout: 32.04%
Canalside
- Will Hemmings, The Green Party – 178
- Anila Javaid, Labour Party – 1,112 (elected)
- Susan Jordan, Liberal Democrats – 542
- Abid Munir Kayani, The Conservative Party – 488
Turnout: 29.49%
Goldsworth Park
- Samar Akhlaq Chaudhary, Labour Party – 254
- Kate Kett, The Green Party – 143
- Chitra Rana, The Conservative Party – 593
- Martin Sullivan, Liberal Democrats – 1,335 (elected)
Turnout: 34.13%
Heathlands
- Canan Kandemir, Labour Party – 135
- Trevor William Leek, The Conservative Party – 1,026
- Jennifer Rebecca Mason, The Green Party – 159
- Leslie James Rice, Liberal Democrats – 1,725 (elected)
- Judith Diana Squire, Heritage Party – 55
Turnout: 44.08%
Hoe Valley
- Louise Morales, Liberal Democrats – 1,477 (elected)
- Ivica Petrikova, The Green Party – 153
- Sebastian James Purbrick, Labour Party – 199
- Colin Patrick Scott, The Conservative Party – 347
Turnout: 30.18%
Horsell
- Philip Michael Christopher Gent, The Conservative Party – 886
- Swati Mukherjee, Liberal Democrats – 2,131 (elected)
- Christine Geraldine Murphy, The Green Party – 197
- John Scott-Morgan, Labour Party – 148
Turnout: 46.69%
Knaphill
- Andy Adcroft, Independent – 755
- Steve Greentree, Liberal Democrats – 1,149 (elected)
- Chris Martin, Labour and Cooperative – 180
- Natalie Pattinson, The Green Party – 84
- Melanie Anne Whitehand, The Conservative Party – 762
Turnout: 36.37%
Mount Hermon
- Zara Coombes, Labour Party – 226
- Sunny John, The Conservative Party – 691
- Ian Johnson, Liberal Democrats – 1,707 (elected)
- Cecilia Scott, The Green Party – 225
- Richard Peter Farr Squire, Heritage Party – 51
Turnout: 37.60%
Pyrford
- John Bond, The Green Party – 136
- Chris Martin, Liberal Democrats – 1,716 (elected)
- Ben Edward Maynard, The Conservative Party – 873
- Sean Francis O`Malley, Labour and Cooperative Party – 233
Turnout: 39.85%
St John’s
- Jayde Tanisha Edwards, The Conservative Party – 536
- Louise Sharon Joyce, The Green Party – 130
- Rob Leach, Liberal Democrats – 1,642 (elected)
- Alexander Thomas Mitchell, Labour Party – 178
- Tim Read, Heritage Party – 90
Turnout: 36.20%
Comments
This article has no comments yet. Be the first to leave a comment.