
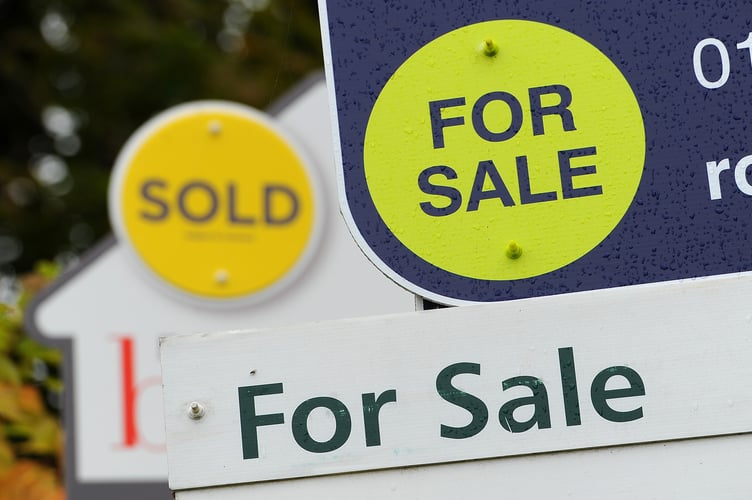
House prices dropped slightly, by 1%, in Woking in July, new figures show.
The drop contributes to the longer-term trend, which has seen property prices in the area suffer a 2.4% annual decline.
The average Woking house price in July was £472,451, Land Registry figures show – a 1% decrease on June.
Over the month, the picture was different to that across the South East, where prices increased 0.5%, and Woking was lower than the 0.5% rise for the UK as a whole.




Over the last year, the average sale price of property in Woking fell by £11,000 – putting the area 57th among the South East’s 64 local authorities with price data for annual growth.
The highest annual growth in the region was in West Oxfordshire, where property prices increased on average by 7%, to £403,000. At the other end of the scale, properties in Eastbourne lost 3.6% of their value, giving an average price of £293,000.
First steps on the property ladder
First-time buyers in Woking spent an average of £344,900 on their property – £7,900 less than a year ago, but £33,400 more than in July 2018.
By comparison, former owner-occupiers paid £583,200 on average in July – 69.1% more than first-time buyers.
Property types
Owners of flats saw the biggest fall in property prices in Woking in July – they dropped 1.1% in price, to £268,774 on average. Over the last year, prices dropped by 1.6%.
Among other types of property:
- Detached: down 0.8% monthly; down 2.3% annually; £1,001,102 average
- Semi-detached: down 1% monthly; down 3.1% annually; £515,130 average
- Terraced: down 0.9% monthly; down 3.3% annually; £408,698 average
How do property prices in Woking compare?
Buyers paid 19.9% more than the average price in the South East (£394,000) in July for a property in Woking. Across the South East, property prices are high compared to those across the UK, where the average cost is £290,000.
The most expensive properties in the South East were in Elmbridge – £678,000 on average, and 1.4 times the price as in Woking. Elmbridge properties cost 2.7 times the price as homes in Southampton (£248,000 average), at the other end of the scale.
The highest property prices across the UK were in Kensington and Chelsea.
Factfile
Average property price in July
- Woking: £472,451
- The South East: £394,096
- UK: £289,824
Annual change to July
- Woking: -2.4%
- The South East: +0.4%
- UK: +0.6%
Highest and lowest annual growth in the South East
- West Oxfordshire: +7%
- Eastbourne: -3.6%